Henríquez-Piskulich, P.; Hugall, A.F.; Stuart-Fox; D. 2024. A supermatrix phylogeny of the world’s bees (Hymenoptera: Anthophila). Molecular Phylogenetics and Evolution 190, 107963. doi:10.1016/j.ympev.2023.107963.
All raw data, code and supplementary material are available in Dryad: https://doi.org/10.5061/dryad.80gb5mkw1
Select species and download bee trees here.
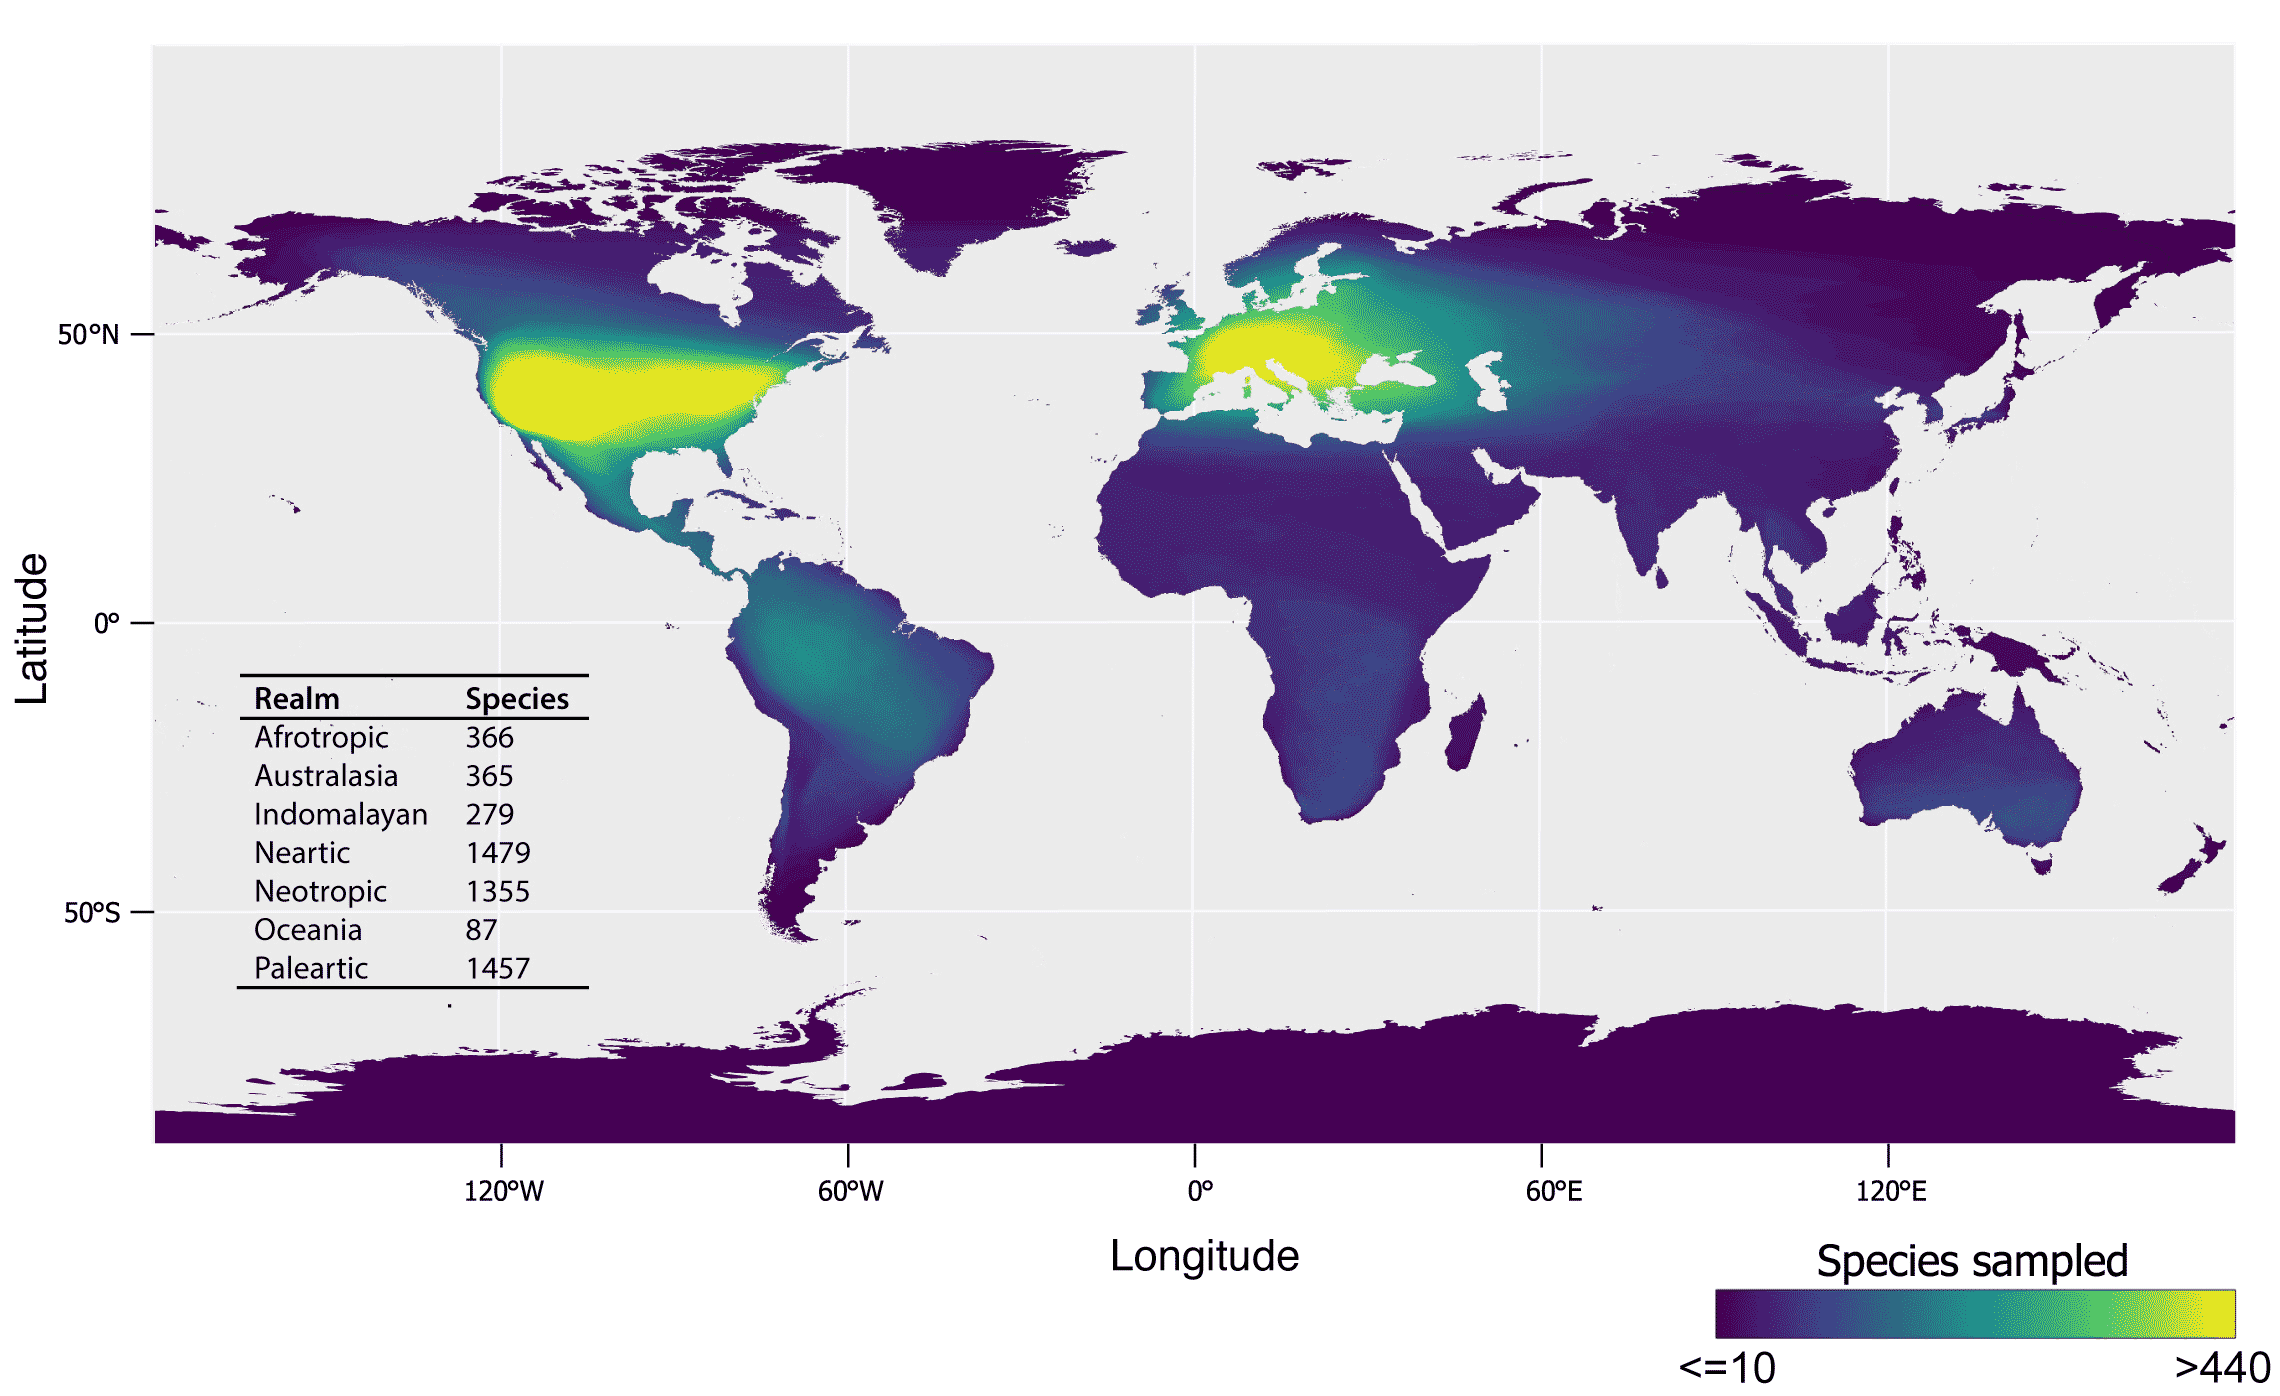 Distribution of bees with available molecular data that was used to build the supermatrix phylogeny. Species in our tree are biased towards the Neartic, followed by the Paleartic and Neotropics, indicating knowledge gaps in bee distribution and under-sampling of all other regions.
 | Family | Total subfamilies* | Total genera | Included genera (%) | Total species | Included species (%) |
| Andrenidae | 3 | 50 | 44 (88) | 2,957 | 639 (22) |
| Apidae | 5 | 211 | 184 (87) | 5,829 | 1,751 (30) |
| Colletidae | 8 | 76 | 66 (87) | 2,616 | 520 (20) |
| Halictidae | 4 | 82 | 61 (74) | 4,400 | 758 (17) |
| Megachilidae | 4 | 83 | 61 (73) | 4,099 | 830 (20) |
| Melittidae | 3 | 15 | 10 (67) | 201 | 82 (41) |
| Stenotritidae | 1 | 2 | 2 (100) | 21 | 6 (29) |
| Totals | 28 | 519 | 428 (82) | 20,123 | 4,568 (23) |